The photometric curve graphically represents the behaviour of light. It illustrates different features relating to the nature of the light source, the type of reflector, optic or the design the lighting fixture, helping select the optimum luminaire or light source for every lighting project.
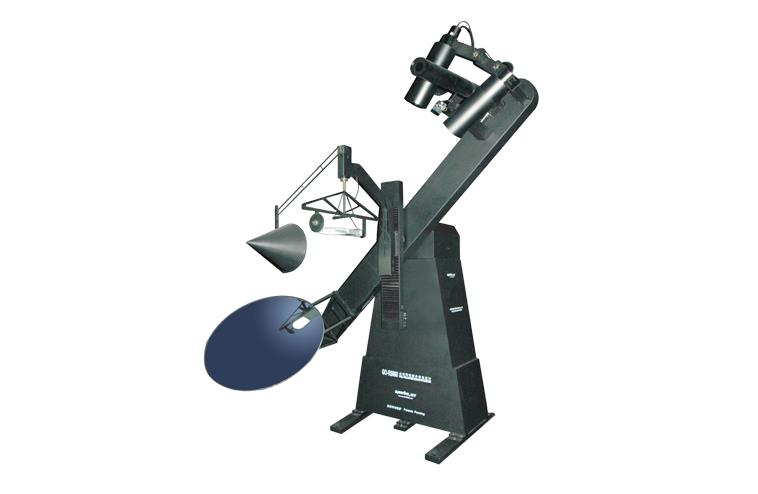
One of the most accurate methods of measuring the light emitted by a light source is by using a goniophotometer, which measures the patterns of luminous intensity emitted by a light source, displaying the photometric properties of the light visible to the human eye.
The aim of this lab test is to understand the forms of luminous distribution and how light intensities are measured.
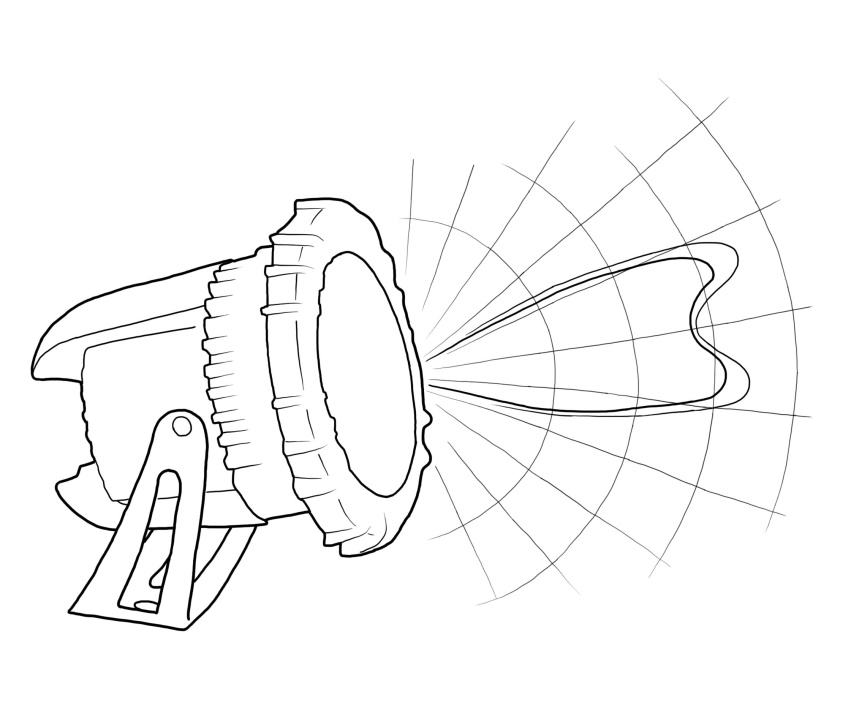
The volume obtained in the laboratory is made up of three coordinates: light intensity (I), vertical plane (C) and the inclination compared to the vertical axis (y). This is called photometric solid and determines the entire spatial luminous distribution.
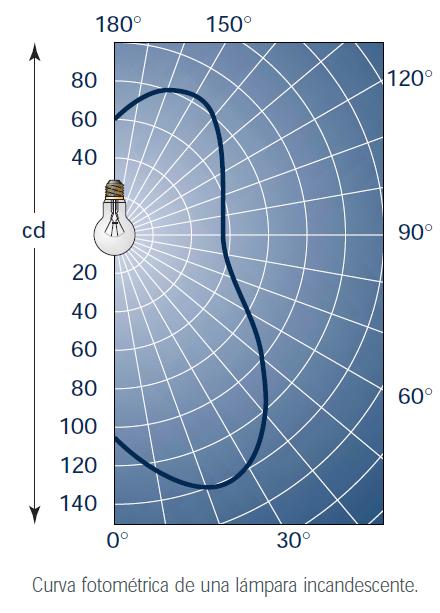
If we pass a plane through the symmetric axis of the light source, we obtain a section limited by a curve which is known as the photometric curve or the luminous distribution curve.
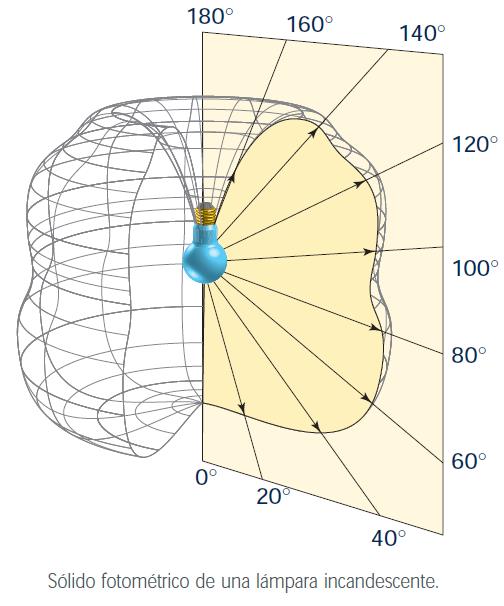
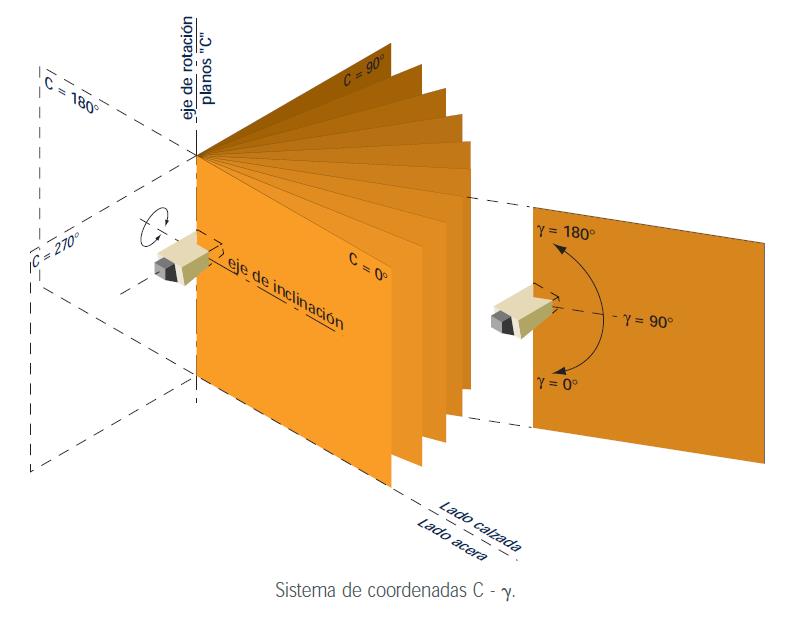
When we position a light source with a reflector/optic, its flux is distorted, producing a volume with a pronounced shape, as it is defined by the very characteristics of the reflector/optic.
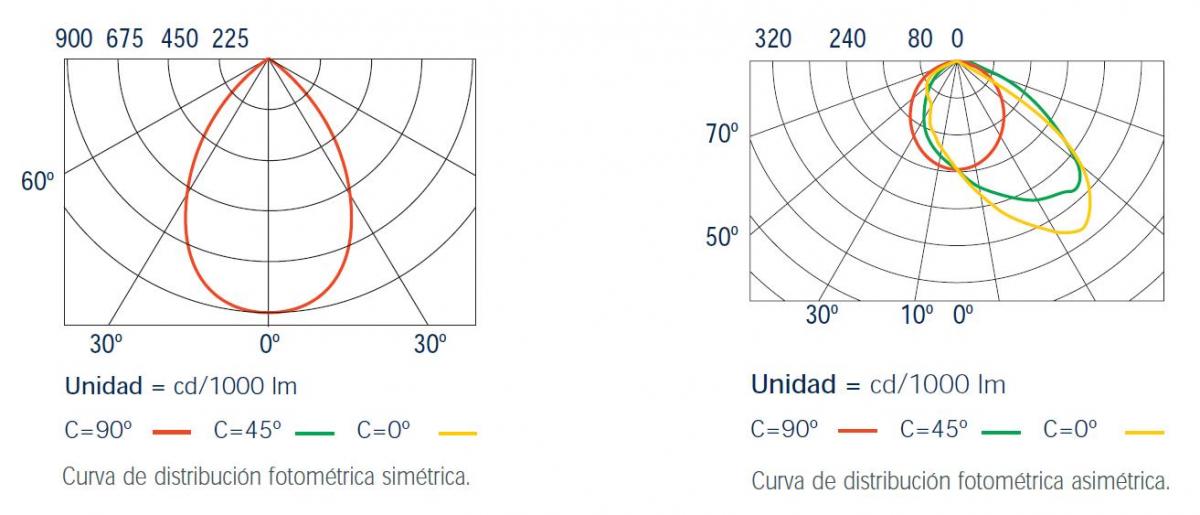
In the following images we can see both examples that represent the distribution curve of the two different optical systems.
The first curve is symmetric and has identical curves for any of the meridional planes, meaning that one single curve is sufficient for its photometric identification. The second curve is asymmetric and, as each plane has a different curve, every plane must be known.
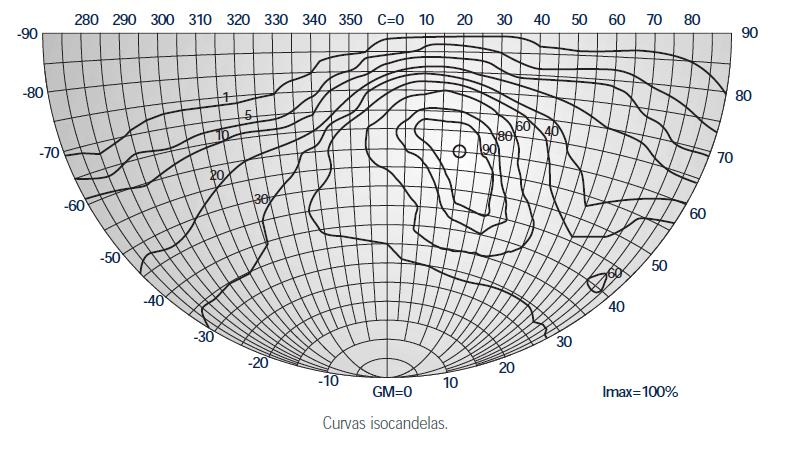
Another method of representing luminous flux distribution is the isocandela curve diagram that represents the points that have the same luminous intensity level curves.
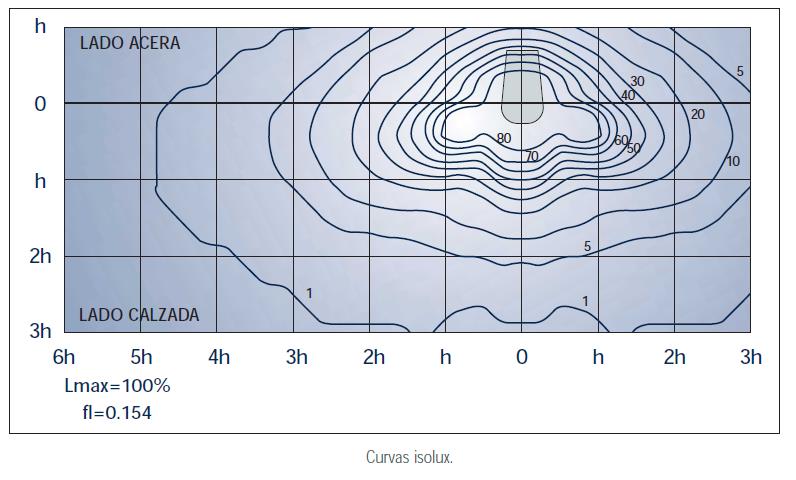
The delineation of the level curves, representing the horizontal illumination projection, are known as isolux curves and correspond to the graphic representation of the illuminance generated by a luminaire on a surface that has been positioned at a specific height.
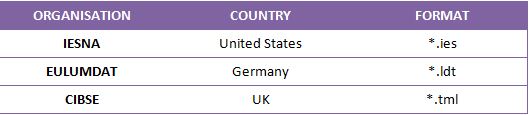
Having completed the lab test, a standard file is obtained which can transfer the photometric data electronically. There are currently several photometric file formats that offer different ways of storing the information.
A luminosity calculation computer programme must be used in order to read these files. Among the programmes currently available on the market are the following: AGi32, Dialux, OxyTech, Relux, WYSIWYG, Calculux and Litestar.
Alejandro Baselga
Regional area manager